Overview of Property Portfolio
Comprising five property segments – Retail, Office, Industrial, V&A Waterfront and GOZ, each focused on achieving sustainable rental growth.
| |
|
RETAIL |
|
|
|
OFFICE |
|
|
|
NDUSTRIAL |
|
|
|
V&A
WATERFRONT** |
|
|
|
GOZ*** |
|
| |
|
Provides leading retail
accommodation
to a diversity of
retailers, restaurants
and banks, mostly
in regional shopping
centres |
|
|
|
Accommodates
businesses in a range
of quality offices,
from high-rise
buildings and office
parks to tailor-made,
company-specific
developments |
|
|
|
Supplies premises
to industries in well-established
industrial
nodes, ranging from
warehousing and
showrooms to high-tech
manufacturing |
|
|
|
Provides quality
accommodation to a
mix of retail, office,
fishing, industrial,
hotel and residential
tenants |
|
|
|
A portfolio of high
quality industrial
warehouses and
offices providing
accommodation
to predominantly
blue-chip Australian
businesses across all
states |
|
| Asset value (Rbn) |
|
28,2 |
|
|
|
33,0 |
|
|
|
10,4 |
|
|
|
6,8 |
|
|
|
22,0 |
|
| Number of properties |
|
58 |
|
|
|
184 |
|
|
|
229 |
|
|
|
1 |
|
|
|
53 |
|
| Gross lettable area (GLA) (m²) |
|
1 410 461 |
|
|
|
1 790 428 |
|
|
|
2 225 075 |
|
|
|
202 658 |
|
|
|
1 050 611 |
|
| GLA as % of total portfolio (%) |
|
21.1 |
|
|
|
26.8 |
|
|
|
33.3 |
|
|
|
3.1 |
|
|
|
15.7 |
|
| Net property income (Rm) |
|
1 470 |
|
|
|
2 122 |
|
|
|
892 |
|
|
|
399 |
|
|
|
1 631 |
|
| Net property income as a % of total
portfolio (%) |
|
22.6 |
|
|
|
32.6 |
|
|
|
13.7 |
|
|
|
6.1 |
|
|
|
25.0 |
|
| Value per m² (R) |
|
20 003 |
|
|
|
18 411 |
|
|
|
4 690 |
|
|
|
33 362 |
|
|
|
20 963 |
|
| Value (excl bulk) per m² (R) |
|
19 996 |
|
|
|
17 562 |
|
|
|
4 589 |
|
|
|
30 840 |
|
|
|
20 963 |
|
| Average gross rental
(R per m²/month) |
|
156 |
|
|
|
142 |
|
|
|
43 |
|
|
|
186 |
|
|
|
188* |
|
| Forward yield (%) |
|
7.7 |
|
|
|
8.4 |
|
|
|
10.1 |
|
|
|
7.0 |
|
|
|
7.3 |
|
| Average in-force escalations (%) |
|
7.4 |
|
|
|
7.7 |
|
|
|
8.4 |
|
|
|
8.3 |
|
|
|
3.0 |
|
| Weighted average lease
period (years) |
|
3.8 |
|
|
|
4.2 |
|
|
|
2.8 |
|
|
|
7.8 |
|
|
|
6.7 |
|
| Property expense ratio (%) |
|
26.3 |
|
|
|
23.1 |
|
|
|
22.4 |
|
|
|
27.8 |
|
|
|
11.6 |
|
| Drivers |
|
Demand for retail
space driven by
retailer expansion
strategies
underpinned by
population growth,
wealth creation and
consumer spend
dynamics |
|
|
|
Changing business
needs, business
growth and
international
company operations
in South Africa |
|
|
|
Distribution and
warehousing
requirements, import
and export demands,
manufacturing
activity, motor
trade dynamics, and
infrastructure spend |
|
|
|
Retail and office
drivers, international
and local tourism and
residential property
market demand
dynamics |
|
|
|
Industrial:
Distribution and
warehousing
demand driven by
activity in the retail,
manufacturing,
import and export
markets, and
changing business
needs and operations
of corporate Australia
Office: changing
business needs and
business growth |
|
* The rental for Australia is shown as average net rental per annum in AUD.
** Represents 50% of the V&A Waterfront.
*** Represents 100% of the GOZ portfolio. |
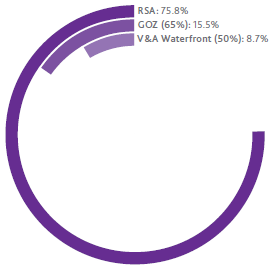
| CONTRIBUTION TO DISTRIBUTION |
|
GEOGRAPHICAL SPREAD BY VALUE |
 |
|
 |

