FINANCIAL DIRECTOR’S REVIEW
| Growthpoint’s distributions are based on sustainable income generated from rentals. The company does not distribute capital profits. Effectively, all rental income received by the company and its 65.0% held subsidiary, Growthpoint Properties Australia (GOZ), less operating costs and interest on debt, including interest received and the 50% portion of the distributable income received from our equity-accounted investments, are distributed to shareholders bi-annually.
Growthpoint is the largest South African-listed REIT with a quality portfolio of 471 directly owned
properties in South Africa valued at R71,6 billion, as well as six equity-accounted investments, with
our share of properties valued at R7,4 billion, of which the V&A Waterfront is by far the largest.
In addition, Growthpoint has a 65.0% interest in GOZ, which owns 53 properties in Australia
valued at R22,0 billion. Through the acquisition of the shares not already owned in the listed
investments Acucap Properties Limited (Acucap) and Sycom Property Fund (Sycom), these entities
became subsidiaries of the Group on 1 April 2015. The remaining listed investment with a value of
R380 million relates to a 22.9% investment in Stenham European Shopping Centre Fund, a
company listed on the Channel Island Stock Exchange as a closed fund and acquired as part of the
Acucap and Sycom business combination.
Growthpoint delivered growth in distributions per share for FY15 of 7.5%. This growth is at the
upper end of the guidance given to the market in the FY14 results of between 7.0% and 7.5%.
Distribution growth was impacted by the payment of the special interim dividend of
44,5 cents per share (R1 058 million in aggregate) which was paid to shareholders five months
earlier than it would have been in the normal course. |
|
 |
Taking the interest benefit of this early
payment, of approximately 1,4 cents per share, into account, shareholders effectively received
growth in distributions per share equal to 8.3%.
Distribution growth has been impacted by a solid performance from the South African portfolio,
especially the V&A Waterfront, and also includes the results of Acucap and Sycom for nine months
as an investment and three months, being April to June, as a subsidiary.
The increase in distributions was further enhanced by the investment in GOZ, where an effective
hedging strategy led to distributions from GOZ being received at an average rate of R9.92:AUD1
compared to R9.57:AUD1 for FY14. Distribution per unit from GOZ grew by 5.3% in Rand terms on
a like-for-like basis.
Acucap and Sycom acquisition
consistent with
Growthpoint’s
growth and
investment strategy
ACQUISITION OF ACUCAP AND SYCOM
At the announcement of Growthpoint’s FY14 result on 27 August 2014, Growthpoint held 34.7% of
Acucap and retained 15.0% of Sycom. Acucap had acquired 82.7% of Sycom. Acucap successfully
acquired a further 1.3% in Sycom. On 1 April 2015, Growthpoint acquired the remaining shares and
voting interests in Acucap by issuing 317 370 060 Growthpoint shares.
The acquisition is consistent with Growthpoint’s growth and investment strategy to build a
diversified property portfolio and offer long-term distribution and capital growth underpinned by
strong underlying contractual cash flows.
 Equity of R11,7 billion raised in FY15
EQUITY RAISED
During the year, Growthpoint issued
426,1 million shares and raised R11,7 billion.
Details thereof are as follows: In September
2014 R1 006 million, in March 2015
R1 199 million and in April 2015 R442 million
was raised through DRIP programmes, where
42,2 million, 46,4 million and 16,3 million
shares were issued at R24.20, R26.25 and
R27.25 per share respectively. The equity
raised from the DRIPs was utilised to finance
Growthpoint’s investment activities.
Growthpoint issued 3,8 million shares for the
acquisition of the remaining 50% interest in
Truzen 75 Trust, as well as the remaining 50%
share in Erven 99 and 100 Parktown Township
Share Block Proprietary Limited.
Growthpoint issued 317,4 million shares in
April 2015 for the purchase of the Acucap
shares it did not already own.
The company has 2,7 billion shares in issue at
FY15 and the authorised capital is 4,0 billion
shares. Growthpoint held 30 631 827 treasury
shares at FY15 (FY14: 32 406 635).
SIMPLIFIED FINANCIAL STATEMENTS
We have included a simplified income statement
and balance sheet in this report. This has been
done in order to make the financial statements
easier to understand, to reflect the cash-based
operating results as used by management
and the Board, and to eliminate fair value and
other non-cash flow adjustments required in
the statutory financial statements in terms of
International Financial Reporting Standards
(IFRS). The management figures have been
reconciled to the figures as reported in terms
of IFRS. We have referred to the Statement of
Profit or Loss and Other Comprehensive Income
as the income statement and the Statement of
Financial Position as the balance sheet for ease
of understanding.
The Group’s accounting policies as set out in the
audited financial statements for the year ended
30 June 2014 have been consistently applied in
the current year and some new standards have
been adopted.
Significant movements in the income statement
and balance sheet are explained below.
NET PROPERTY INCOME
The increase in gross revenue of 20.7% for FY15
compared to FY14, was due to the acquisitions
of Acucap and Sycom, as well as the revenue
from GOZ (14.0%), resulting from property
acquisitions made and a favourable increase in
the average exchange rate applied. Disposals
amounting to R651 million were made in the
RSA portfolio in FY14 and impacted negatively
on revenue growth in the current period.
The ratio of property expenses to revenue for
the Group has decreased slightly from 21.6%
to 21.1% at FY15. For RSA the ratio reduced
marginally to 24.0%.
FINANCE AND OTHER INVESTMENT
INCOME
Finance income increased by 4.8% from
R545 million to R571 million. Including other
income for dividends, total income increased
by 68.1% to
R916 million due to distributions
received from Acucap and Sycom.
INTEREST PAID
Interest costs increased by 19.3% from
R1 748 million to R2 086 million as a result
of the further investments made in GOZ,
loans advanced to the V&A Waterfront as well as the special dividend paid in April 2015
relating to the Acucap and Sycom acquisition.
These outflows were somewhat negated
by the proceeds from the DRIPs offered by
Growthpoint. The weighted average interest
rate for RSA borrowings was 8.9% (FY14: 9.4%).
Finance costs for GOZ decreased by 9.4% from
R467 million in FY14 to R423 million in FY15.
The additional equity raised by GOZ was used
for the acquisition of properties and to settle
debt, resulting in the decrease.
The interest cover ratio, whereby the income
from the equity-accounted investments and
listed investments is included in the operating
profit, increased from 3.3 at FY14 to 3.4
at FY15.
PROPERTY ASSETS
Acquisitions: In addition to the acquisition
of the Acucap and Sycom portfolios, on
1 September 2014 Growthpoint acquired
the remaining 50% interest in the properties
owned by Truzen 75 Trust from the remaining
beneficiaries, as well as the remaining shares
in Erven 99 and 100 Parktown Township Share
Block Proprietary Limited from Zenprop.
Growthpoint also acquired one industrial
property for R21 million and two other office
properties for R95 million during the year.
Development and capital expenditure for RSA
amounting to R1,9 billion (FY14: R1,0 billion)
relates to various projects undertaken during
the year, of which the Discovery Head Office
(owned 55%) and Bridgeway Park Office Block
accounted for R420 million and R83 million,
respectively.
GOZ acquired land for an office property
development situated at 211 Wellington
Road, Mulgrave, Victoria for R67 million
(AUD7 million) and incurred development
expenditure in respect of this land amounting
to R252 million (AUD27 million) during the
year. Three industrial properties were acquired
by GOZ for R571 million (AUD60 million).
Development and capital expenditure at the
V&A Waterfront amounted to R309 million
(FY14: R276 million) for the year.
Disposals: Growthpoint RSA disposed of
18 properties in the current year (FY14: 14)
for R621 million (FY14: R651 million) with a
collective R205 million (FY14: R132 million)
profit on cost achieved.
At 30 June 2015, five RSA properties
(FY14: eight) valued at R539 million (FY14: R265 million) were classified as held
for sale assets.
Fair value adjustments: The revaluation of
properties resulted in an upward revision of
R3,4 billion (3.8%) to R93,6 billion for
investment property (including investment
properties reclassified as held for sale). This
was mainly due to an increase in future
contractual rental. Interest-bearing borrowings
and derivatives were fair valued using the
swap curve at FY15, resulting in a decrease
of R272 million in the overall liability. In addition a loss of R116 million was realised
on the settlement of an interest rate swap
by GOZ.
These fair value adjustments, together with
the other non-distributable items such as
capital items, non-cash charges, deferred
taxation and the net effect of the non-controlling
interest’s portion of the nondistributable
items, were transferred to the
non-distributable reserve.
EQUITY-ACCOUNTED INVESTMENTS:
V&A WATERFRONT AND OTHER
The investments in the V&A Waterfront and
the other joint ventures have been accounted
for in terms of IFRS 11, Joint Arrangements. The
equity-accounting method was used, whereby
the Group’s share of the Profit or Loss and
Other Comprehensive Income of these
investments was accounted for.
Included in the FY15 finance income is
R368 million of distributable income from the
V&A Waterfront, compared to distributable
income for FY14 of
R332 million.
The investment in the V&A Waterfront and
the other joint ventures, have been accounted
for in the Statement of Financial Position as
the fair value of Growthpoint’s 50% interest in
the net asset value amounting to R6,0 billion
(FY14: R5,6 billion) for the V&A Waterfront
and R417 million
(FY14: R148 million) for the
other joint ventures.
INVESTMENT IN GOZ
Growthpoint increased its investment in GOZ
from R5,3 billion at FY14 to R5,9 billion at
FY15. This further investment of R607 million
related to Distribution Reinvestment Plans
(DRIPs), where Growthpoint elected not to
receive the distributions in August 2014 and
February 2015, but to reinvest the distributions
in GOZ.
The total amount invested at year-end by
Growthpoint for its 65.0% interest amounts
to R5,9 billion, the market value of which was
R10,9 billion at
30 June 2015.
Included in normal tax in the Statement of Profit
or Loss and Other Comprehensive Income,
is R73 million (FY14: R24 million) that relates
to withholding tax paid on the distributions
received from GOZ.
OTHER MATTERS
We remain aware of the possible impact
of carbon tax on our RSA business. For
Growthpoint’s direct emissions the cost is low,
but we are cognisant of the possible impact on
our tenants.
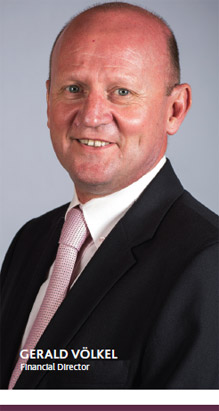
G Völkel
Financial Director
8 September 2015
SIMPLIFIED DISTRIBUTION INCOME STATEMENT
| |
|
|
Total
Group |
Total
Group |
| For the year ended 30 June |
Notes |
|
FY15
Rm |
FY14
Rm |
| Revenue |
1 |
|
7 740 |
6 412 |
| Property expenses |
|
|
(1 630) |
(1 384) |
| Net property income |
|
|
6 110 |
5 028 |
| Asset management costs |
|
|
(238) |
(167) |
| Other operating expenses |
|
|
(65) |
(100) |
| Finance and other investment income |
6 |
|
986 |
845 |
| Interest paid |
|
|
(2 086) |
(1 748) |
| Profit before taxation |
|
|
4 707 |
3 858 |
| Taxation |
7 |
|
(72) |
(28) |
| Profit before dividends and debenture interest |
|
|
4 635 |
3 830 |
| Minorities’ share of profit and realised foreign exchange loss |
|
|
(403) |
(333) |
| Dividends (including dividends on treasury shares) |
|
|
(4 232) |
(3 497) |
| Retained profit |
|
|
– |
– |
| Number of shares in issue (including treasury shares) |
|
|
2 711 056 264 |
2 284 908 257 |
| Dividend per share (cents) |
|
|
173,4 |
161,3 |
SIMPLIFIED BALANCE SHEET
| |
|
|
Total
Group |
Total
Group |
| |
Notes |
|
FY15
Rm |
FY14
Rm |
| At 30 June |
|
|
|
|
| ASSETS |
|
|
|
|
| Property assets |
8 |
|
93 574 |
69 913 |
| Equity-accounted investments |
|
|
6 464 |
5 722 |
| Intangible assets |
9 |
|
2 388 |
1 038 |
| Derivative assets |
|
|
105 |
12 |
| Long-term loans granted |
|
|
614 |
466 |
| Listed investments |
|
|
380 |
4 457 |
| Equipment |
|
|
9 |
10 |
| Current assets |
|
|
2 677 |
1 406 |
| Cash and cash equivalents |
|
|
505 |
375 |
| Other current assets |
|
|
2 172 |
1 031 |
|
|
|
|
|
| Total assets |
|
|
106 211 |
83 024 |
| EQUITY AND LIABILITIES |
|
|
|
|
| Shareholders’ interest |
|
|
63 369 |
49 895 |
| Non-controlling interest |
|
|
4 713 |
4 180 |
| Nominal value of interest-bearing liabilities |
10 |
|
33 811 |
25 045 |
| Market adjustments on interest-bearing liabilities |
10 |
|
874 |
1 089 |
| Deferred taxation |
11 |
|
1 425 |
1 205 |
| Current liabilities |
12 |
|
2 019 |
1 610 |
| Total equity and liabilities |
|
|
106 211 |
83 024 |
RECONCILIATION BETWEEN STATUTORY AND SIMPLIFIED FINANCIAL STATEMENTS
FOR THE YEAR ENDED 30 JUNE 2015
| NOTES |
FY15
Rm |
FY14
Rm |
| 1 |
Revenue as stated |
7 870 |
6 605 |
| |
Less: straight-line lease income adjustment |
(130) |
(193) |
| |
|
7 740 |
6 412 |
| 2 |
Fair value adjustments as stated |
3 562 |
2 396 |
| |
Less: fair value adjustments reversed |
(3 562) |
(2 396) |
| |
|
– |
– |
| 3 |
Equity-accounted investment profit |
484 |
91 |
| |
Less: equity-accounted investment profit reversed |
(484) |
(91) |
| |
|
– |
– |
| 4 |
Non-cash charges as stated |
1 723 |
(78) |
| |
Less: non-cash charges reversed |
(1 723) |
78 |
| |
|
– |
– |
| 5 |
Capital items as stated |
1 078 |
(23) |
| |
Less: capital items reversed |
(1 078) |
23 |
| |
|
– |
– |
| 6 |
Finance and other investment income as stated |
916 |
545 |
| |
Add: cash adjustment on business acquisition |
4 |
110 |
| |
Add: dividends received on treasury shares |
66 |
25 |
| |
Add: distribution received on listed investments |
– |
165 |
| |
|
986 |
845 |
| 7 |
Taxation as stated |
(264) |
(160) |
| |
Add back: deferred taxation |
192 |
132 |
| |
|
(72) |
(28) |
| 8 |
Property assets as stated |
93 035 |
69 648 |
| |
Add back: investment property reclassified as held for sale (included in current assets) |
539 |
265 |
| |
|
93 574 |
69 913 |
| 9 |
Intangible assets as stated |
2 580 |
1 258 |
| |
Reversal of additional goodwill raised on deferred taxation liability* |
(192) |
(220) |
| |
|
2 388 |
1 038 |
| 10 |
Non-current financial liabilities as stated |
28 755 |
21 591 |
| |
Add: reclassification of current financial liabilities |
5 930 |
4 543 |
| |
Less: nominal value of interest bearing long-term liabilities |
(33 811) |
(25 045) |
| |
Market adjustments on interest bearing liabilities |
874 |
1 089 |
| 11 |
Deferred taxation as stated |
1 617 |
1 425 |
| |
Reversal of additional deferred tax liability on intangible asset |
(192) |
(220) |
| |
|
1 425 |
1 205 |
| 12 |
Current liabilities as stated |
7 949 |
6 153 |
| |
Less: reclassification of current portion of non-current financial liabilities |
(5 930) |
(4 543) |
| |
|
2 019 |
1 610 |
| |
* |
In terms of IFRS 3, Business Combinations, goodwill was increased with the deferred tax liability that was raised on initial recognition of the intangible asset acquired in terms of the acquisition of the property services businesses. Applying the principle that the Group will recover the carrying value of the intangible asset through use
rather than through sale, the tax base was determined to have no value, which gave rise to the deferred tax liability. The deferred tax liability will reverse over time as
the intangible assets to which it relates are amortised over a 15-year period. |

