GROWTHPOINT
AUSTRALIA (GOZ)
 THE INVESTMENT IN GOZ
Growthpoint’s 65% share of GOZ performed exceptionally for FY15. GOZ was one of the best
performing A-REITs in FY15 and delivered a total AUD return of 36.4% to Growthpoint. The
distributions received from GOZ during the year amounted to R658 million.
Distributions from GOZ grew 28.3% in Rand, making a solid 15.5% contribution to Growthpoint’s
overall distributable income, notwithstanding the weakening of the AUD against the Rand.
GOZ has grown significantly since Growthpoint’s initial acquisition in 2009. It has grown its market
capitalisation to AUD1,8 billion and owns assets of AUD2,3 billion.
GOZ achieved the major milestone of becoming a component of the S&P/ASX200, which has seen
a marked improvement in its liquidity and tradability, adding to shareholder value. Its share price
increased from AUD2.45 to AUD3.13 at FY15. Growthpoint continues to support the growth of
GOZ to improve the liquidity and tradability of the company’s shares and drive value enhancement
for all shareholders.
During the year we invested a further R607 million in GOZ, by way of supporting the Distribution
Reinvestment Plans (DRIPs), where Growthpoint elected to reinvest its distributions receivable
from GOZ. Our shareholding in GOZ remained largely unchanged for FY15, ending the year at 65%.
It has been financially rewarding to support the growth of GOZ and we intend to continue to do
this. It remains a good investment for Growthpoint and has delivered a total return of 31.9% in
Rand terms. To date our investment in GOZ has cost a total of R5,9 billion and the market value is
R10,9 billion.
During the year GOZ continued to invest in quality commercial Australian real estate. It acquired
AUD119,5 million of office and industrial properties.
GOZ brought down its debt levels in line with its strategy. Its gearing was reduced to 37.0% at FY15
from 40.9% at FY14 — within its target range — placing it in a conservative financial position. GOZ
maintained its Moody’s investment grade credit rating (Baa2), which was first issued in August
2014. GOZ’s reduction in gearing and credit rating enabled it to raise an AUD200 million 10-year
bond and diversify its sources of funding. GOZ also reduced its cost of debt over the period from a
weighted average interest rate of 5.8% at FY14 to 4.8% at FY15.
Although GOZ grew its distribution by 3.7%, the AUD weakened against the Rand and together
with the increased level of withholding tax was detrimental to Growthpoint.
How GOZ offers Growthpoint and our shareholders value:
| • |
The size of our investment in Australia at a fair value of R10,9 billion is large enough to have an
impact on Growthpoint without changing the nature of the company or exposing it to excessive
foreign risk |
| • |
It provides Growthpoint international diversification and exposure to a developed and stable
economy that has prospered throughout the global financial crisis |
| • |
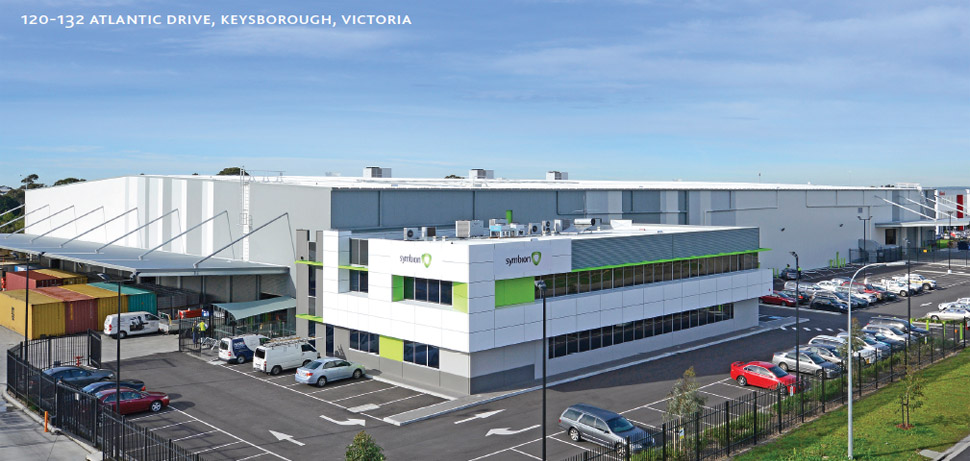
It is a pure Australian investment with 53 properties located in all Australian states with good
proximity to key infrastructure, particularly CBDs, ports, airports and major arterial road
networks |
| • |
It is a low-risk investment in Australia with most of its rental income coming from some of
Australia’s largest and most stable companies. |
MARKET ENVIRONMENT
Although vacancy rates remain elevated in most office markets in Australia, there has been an
improvement in Sydney and Melbourne over FY15. Buyer demand for quality office and industrial
property is still outstripping supply and is coming from A-REITs, domestic wholesale funds,
superannuation funds, syndicators and offshore investors and this should support asset values
particularly for assets like GOZ’s which are typically leased long-term to quality tenants. This strong
buyer demand was demonstrated by the sale processes for the Investa office portfolio and the GIC/Australand industrial portfolio, which have reportedly sold for AUD2,45 billion and in excess of
AUD1,0 billion, respectively. These transactions are expected to lead to further yield compression
in the short to medium term.
Valuation increases arising from lower
capitalisation rates are expected to continue in
FY16 as demand to acquire well-leased, quality
property continues to increase in Australia.
Although GOZ’s property portfolio saw a
significant increase in valuations over the
year, there remains further potential valuation
upside.
| GOZ VALUE BY GEOGRAPHIC DIVERSITY |
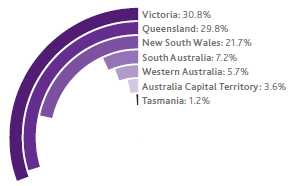 |
PERFORMANCE
GOZ has completed its sixth year of growth in
distributions, net tangible assets and security
price.
GOZ owns an enviable AUD2,3 billion portfolio
of modern, well-leased and well-located
properties in every State of Australia, split
51%/49% between office and industrial. Other
key features include a long weighted average
lease expiry or WALE of 6.7 years, weighted
average fixed rent reviews of 3.0% per annum,
a high occupancy rate at 96.5% and only 6.0%
of the portfolio leases potentially expiring over
the next two financial years.
Following a mix of internal and external
valuations, GOZ’s properties increased in value
by AUD186.0 million over FY15 or by 9.0% on
a like-for-like basis. This reflected a general
increase in demand for the type of assets
GOZ owns: modern, well-leased properties in
excellent locations.
Like-for-like net property income growth was
1.0% for the portfolio for the six months to
30 June 2015 with office increasing by 1.2% and
industrial increasing by 0.8%. A 0.1% increase
was recorded on a like-for-like basis from FY14
with industrial increasing by 2.4% and office
declining by 2.1%. The like-for-like decline for
office was due to increased vacancy and tenant
incentives for new or extended leasing.
Over 69 000m² of new and extended leasing
out of a total portfolio of 1 050 611m² was
undertaken in FY15. Whilst GOZ has achieved
significant leasing success to date, the Brisbane
office market remains challenging and this
is where the majority of GOZ’s upcoming
potential lease expiries are located. However,
given that only 6% of the portfolio’s leases
come up for renewal over the next two years,
primarily within the industrial portfolio, and the
excellent portfolio, GOZ is confident that it will
maintain a high occupancy level over the short
to medium term.
The existing portfolio was strengthened
by AUD119,5 million of acquisitions during
FY15, an AUD20,8 million acquisition in early July 2015 and the AUD26,7 million disposal
of two non-core assets at or above previous
book value. GOZ may look to divest a portfolio
of assets in FY16 to take advantage of strong
demand for property in Australia.
FY15 operating expenses as a percentage of
average gross assets returned to its longer-term
average of 0.4% versus 0.5% in FY14. GOZ
expects its operating expenses to remain at this
level in FY16.
PROSPECTS
GOZ continues to actively consider a number of
development opportunities within its existing
portfolio including:
| • |
The redevelopment of part of a Richmond
site in Victoria for offices, subject to a precommitment
being in place. A planning
permit has been issued for construction
of an 18 000m² office building. GOZ may
also explore the potential for a residential
redevelopment of part of this site |
| • |
Tenant-initiated expansions at five industrial
properties in Queensland and Victoria |
| • |
The redevelopment or change of use of a
25 hectare site at 120 Northcorp Boulevard,
Broadmeadows, Victoria where Woolworths
has announced that it will be closing its
facility. The lease of this facility currently
expires in July 2021 |
| • |
A significant potential development of
522-550 Wellington Road, Mulgrave,
Victoria should Woolworths decide not to
renew its lease in July 2021. This 19.1 hectare
site adjoins a large residential estate and
offers long-term residential development
opportunities subject to re-zoning |
| • |
The other four distribution centres leased to
Woolworths offer significant development
potential should Woolworths require
additional lettable area as these sites have
low site coverage of approximately 30%. |
| Further potential
valuation upside of
property portfolio |
| Continue to actively
consider a number
of development
opportunities within
existing portfolio |
Key performance areas
| |
FY15 |
|
FY14 |
|
Increase/
(decrease) |
|
| Gross property revenue (R’million) |
1 844 |
|
1 617 |
|
227 |
|
| Property expenses (R’million) |
(213) |
|
(196) |
|
17 |
|
| Net property income (R’million) |
1 631 |
|
1 421 |
|
210 |
|
| Property expense ratio (%) |
11.6 |
|
12.1 |
|
(0.5) |
|
| Vacancies (%) |
1.0 |
|
1.5 |
|
(0.5) |
|
| Arrears (R’million) |
0,4 |
|
6,9 |
|
(6,5) |
|
| Bad debt provision (R’million) |
– |
|
1,0 |
|
(1,0) |
|
| Average gross rental (AUD per m2/annum) |
188 |
|
192 |
|
(4) |
|
| Forward yield (%) |
7.3 |
|
8.2 |
|
(0.9) |
|
| Average in-force escalation (%) |
3.0 |
|
3.1 |
|
(0.1) |
|
| Weighted average lease period (years) |
6.7 |
|
6.9 |
|
(0.2) |
|
| Asset value (R’billion) |
22.0 |
|
20.9 |
|
1.1 |
|
| Number of properties |
53 |
|
51 |
|
2 |
|
| GLA (m2) |
1 050 611 |
|
1 036 740 |
|
13 871 |
|
| Value (excluding bulk) per m2 (R) |
20 963 |
|
20 120 |
|
843 |
|
| Capital expenditure (R’million) |
306 |
|
416 |
|
(110) |
|
 |
| |
| GOZ LEASE EXPIRY % OF GLA |
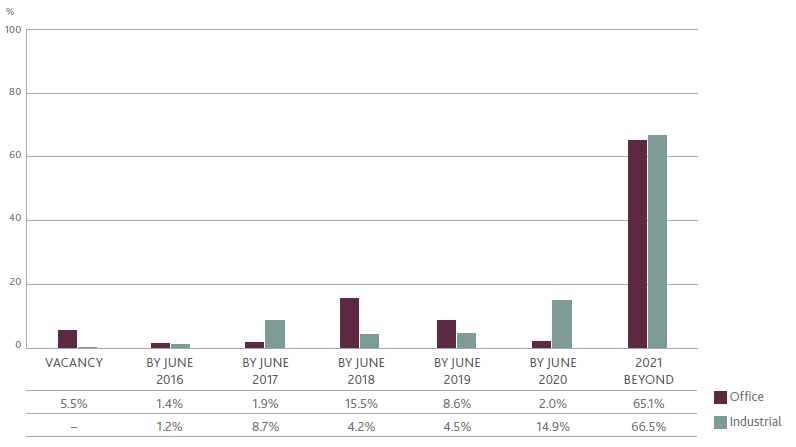 |
| GOZ LEASE EXPIRY % OF GROSS RENTAL |
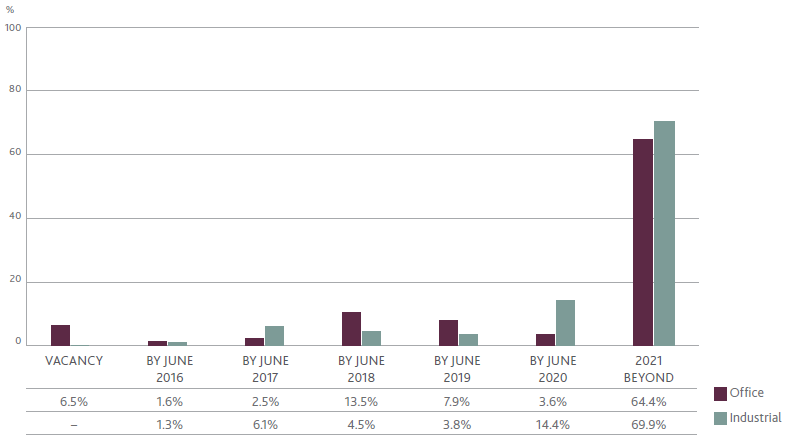 |
| Sixth year of growth in distribution, net
tangible assets and security price |
Top 10 GOZ tenants
| |
Tenant |
GLA*
m2 |
% of
total V&A
GLA |
| 1 |
Woolworths |
406 941 |
39.1 |
| 2 |
NSW Police |
31 954 |
3.1 |
| 3 |
GE Capital Finance Australasia |
24 910 |
2.4 |
| 4 |
Linfox |
58 077 |
5.6 |
| 5 |
Commonwealth of Australia – DEEWR |
15 398 |
1.5 |
| 6 |
Jacobs Engineering |
9 595 |
0.9 |
| 7 |
Energex |
8 754 |
0.8 |
| 8 |
Fox Sports |
8 092 |
0.8 |
| 9 |
Star Track Express |
44 424 |
4.3 |
| 10 |
Downer EDI Mining |
5 636 |
0.5 |
| Total of Top 10 |
613 781 |
59.0 |
| * Ranked in terms of gross monthly rental. |
Top 10 GOZ properties by value
| |
Property name |
|
Location |
Value
Rm |
|
% of total
GOZ portfolio |
|
GLA*
m2 |
|
% of total
GOZ
GLA |
|
| 1 |
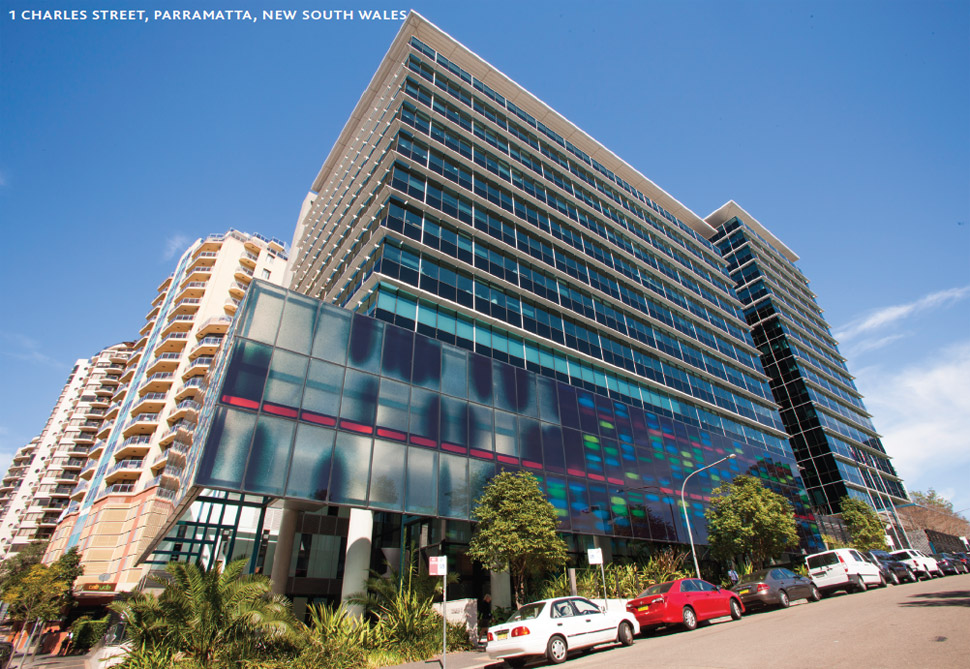
1 Charles Street, Parramatta |
|
New South Wales |
2 457 |
|
11.2 |
|
31 954 |
|
3.0 |
|
| 2 |
70 Distribution Street, Larapinta |
|
Queensland |
1 818 |
|
8.3 |
|
75 425 |
|
7.2 |
|
| 3 |
20 Colquhoun Road, Perth Airport |
|
Western Australia |
1 259 |
|
5.7 |
|
80 374 |
|
7.7 |
|
| 4 |
219-247 Pacific Highway, Artarmon |
|
New South Wales |
973 |
|
4.4 |
|
14 496 |
|
1.4 |
|
| 5 |
1231-1241 Sandgate Road, Nundah |
|
Queensland |
876 |
|
4.0 |
|
12 980 |
|
1.2 |
|
| 6 |
333 Ann Street, Brisbane |
|
Queensland |
855 |
|
3.9 |
|
16 490 |
|
1.6 |
|
| 7 |
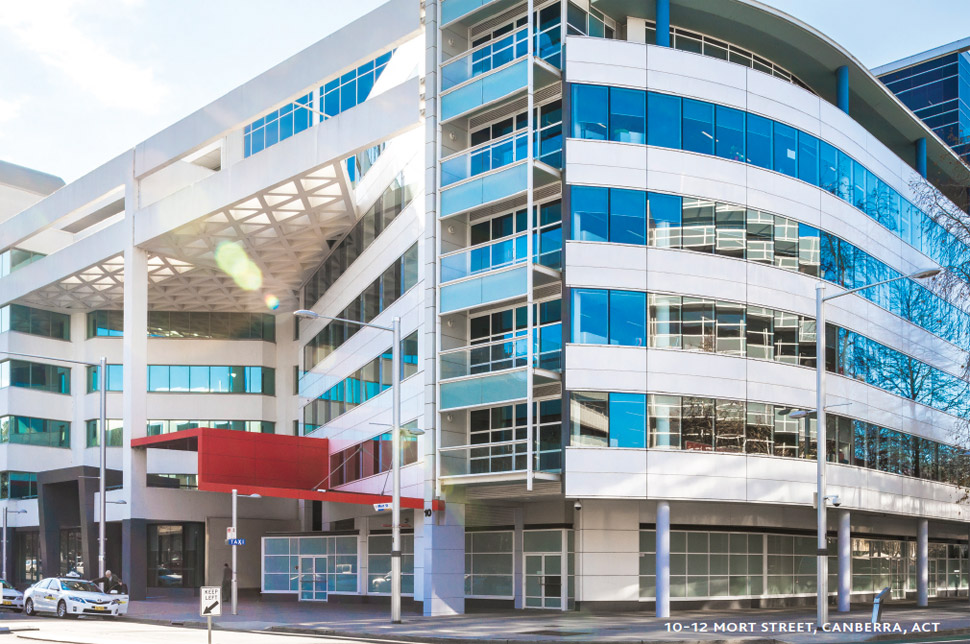
10-21 Mort Street, Canberra |
|
Australia Capital
Territory |
799 |
|
3.6 |
|
15 398 |
|
1.5 |
|
| 8 |
22 Cordelia Street, South Brisbane |
|
Queensland |
780 |
|
3.5 |
|
11 529 |
|
1.1 |
|
| 9 |
28 Bilston Drive, Wodonge |
|
Victoria |
756 |
|
3.4 |
|
57 440 |
|
5.5 |
|
| 10 |
572-576 Swan Street, Richmond |
|
Victoria |
738 |
|
3.4 |
|
14 660 |
|
1.4 |
|
| Total of Top 10 |
|
|
11 311 |
|
51.4 |
|
330 746 |
|
31.6 |
|
| International diversification and exposure to a
developed and stable economy |