Remuneration Report
The Board of Growthpoint Properties Limited
(the company) and the Remuneration Committee
(the committee) have pleasure in submitting
the remuneration report for the financial year
ended 30 June 2015. This report sets out the
company’s remuneration policy and strategy
for all employees and sets out the detailed
implementation and disclosure of remuneration
for executive directors, Executive Committee
members and non-executive directors. The
information provided in this report has been
approved by the Board on the recommendation
of the committee.
The Remuneration Committee has worked with
its independent advisors, PwC, for guidance
on responsible and appropriate remuneration
principles in respect of decisions that are
adopted and implemented by the committee.
The committee has also taken cognisance of
the performance of the company and the value
creation for shareholders during the year and
believes that our remuneration policy and the
implementation thereof reflects alignment of the
Group’s business strategy and long-term goals
with the interests of shareholders. The committee
is satisfied that the overall principles laid down
by the King code of Governance for South Africa
(King III) and the Companies Act, 2008 (the
Act) have been adhered to unless specifically
stated and explained. The SA property industry
continues to be active, characterised by a
number of new listings and significant corporate
activity, including consolidations. The demand
for industry specific skills within our limited pool
of talent remains high, and therefore also the risk
of retention. Our Executive Retention Scheme
(ERS), launched during the 2014 financial year
to address these serious retention risks, has been
an integral part of our remuneration mix, and has
assisted us in retaining the talent which is so vital
to our organisation.
Whilst we continually work towards increasing
and diversifying our property portfolio, we are
focused on ensuring that we invest in quality
properties that will deliver superior value and
long-term benefits for our stakeholders. We
take a long-term view on growth and success,
and are committed to being the leading South
African property company. The retention of our
key employees is vital, and skills retention and
attraction has been identified as a key risk area for our business – without these employees, we
could face a lack of experience, decision-making
ability, competence, capability and quality of
staff, as well as a loss of “corporate memory” – all
areas which are vital to our success, and to enable
us to deliver value to you, our stakeholders.
Whilst we believe in pay for performance, we
remain acutely aware of the fierce war for talent
within our industry.
With this in mind, we take great care to ensure
that our remuneration mix is appropriate –
that each executive and member of senior
management has enough outstanding value to
ensure that he or she is retained, and that there
is a reasonable level of confidence that the
value in terms of our various share schemes will
be realised. Our ERS went a long way to address
concerns we had surrounding retention risks,
and whilst no further awards are contemplated
at present, we will retain this tool to use where
appropriate, for instance in the attraction of key
talent which will help us in unlocking value for
all of our stakeholders. The first vesting of ERS
awards will be in April 2016. We will continue to
monitor the outstanding award levels of our key
employees, to ensure that we are able to address
any retention risks.
We believe our key performance indicators which
are used for the measurement and determination
of short-term incentive awards are aligned
with company goals and strategies, whilst the
targets set provide sufficient stretch to challenge
executive management but at the same time
are not completely unachievable resulting in
management being demoralised. Given the
rapidly changing environment in the listed
property sector and emergence of a two-tier
market characterised by property hedge funds on
the one hand and more traditional rent collecting
property companies on the other hand, the
committee is of the opinion that the peer group
and the peer groups benchmark which is used for
determining short-term incentive awards might
need to be reviewed to ensure its relevance when
considering the company’s long-term strategies
and focus on owning a lower yielding quality
property portfolio.
We are determined to ensure that all our staff
members are engaged and motivated to perform.
To ensure that this happens, we continue to make
awards of zero cost options to all staff (excluding the executive directors and Executive Committee
members) under the Growthpoint Staff Incentive
Scheme (GSIS), and have undertaken significant
work during the year on the remuneration levels
of junior workers.
Being conscious of increasing social issues in
the country and negative perceptions of the
significant gaps between what the lowest
paid employees earn and what executive
management earn, the committee sought advice
from PwC as to what level of remuneration
constituted a “living wage” and as a result are
in the process of adjusting the remuneration of
83 of the lowest paid employees to a minimum
of R120 000 (which amount does not include
any STI payments or value realised from
participation in the GSIS). These adjustments
will be made over the next two years and are a
continuation of the company’s efforts to reduce
income disparity by reducing the wage gap whilst
“doing the right thing” in terms of paying the
lowest earners a living wage.
HS Herman
Remuneration Committee Chairman
25 August 2015
The report this year is again segmented
into two parts, separating the disclosure
of policy (Part 1) and its implementation
(Part 2).
PART 1: REMUNERATION PHILOSOPHY AND POLICY
THE COMMITTEE
Role of the committee
The committee assists the Board in setting
the company’s remuneration policy and
executive as well as non-executive directors’
and executive management’s remuneration.
The committee’s Terms of Reference are set
out in the Corporate Governance section of the
Integrated Annual Report.
Members of the committee
Details of the members of the committee can
be found in the Corporate Governance section
of the Integrated Annual Report.
All the current members of the committee
are independent non-executive directors.
The committee met five times during the
financial year ended
30 June 2015. The Chief
Executive Officer, Managing Director and Head
of Human Resources attended the committee
meetings by invitation and assisted the
committee in its deliberations, except when
issues relating to their own remuneration
were discussed. PwC attended the meetings in
their capacity as independent advisors to the
committee.
Summary of remuneration activities/decisions undertaken during FY15
The main issues considered and approved by
the committee during FY15 were as follows:
| • |
Approval of the remuneration report |
| • |
Short-term incentives for executive directors
and Executive Committee members |
| • |
Share incentive plan awards to all eligible
employees and approval of vesting of awards |
| • |
Annual salary review for executive directors
and Executive Committee members |
| • |
Mandate for salary increases for all other
employees |
| • |
Review of executive directors’ service
contracts |
| • |
Review of fees to non-executive directors |
| • |
Review and approval of remuneration policy. |
REMUNERATION POLICY SUMMARY
Remuneration of executive directors and Executive Committee members
The table below summarises the individual elements of the total remuneration package offered to executive directors and Executive Committee
members during FY15.
| Element |
|
Purpose and link to strategy |
|
Detail |
| Fixed |
|
Guaranteed Cost to Company (GCTC)
Total fixed remuneration paid in cash |
|
Ensures that each individual’s role is compensated at market-related levels which recognises the individual’s skill and experience |
|
GCTC is set to be competitive and is set at the median of
the comparator group. For key employees, GCTC may be
set at the upper quartile
GCTC is reviewed annually, and the committee considers
the following in its review:
| • |
company and individual performance |
| • |
affordability |
| • |
changes in responsibilities |
| • |
internal and external benchmarks |
| • |
average salary increases for the entire Growthpoint workforce |
|
| Benefits |
|
Benefits include:
| • |
included in GCTC: |
| |
| – |
contributions to a defined contribution retirement plan |
| – |
contributions to a medical aid scheme |
|
| • |
company paid: |
| |
| – |
personal accident, dreaded disease and AdmedGap (hospitalisation gap cover) insurance policie |
|
|
| Variable |
|
Short-term incentive (STI) including
a cash payment and a Deferred
Incentive |
|
Drives and rewards the achievement
of the company’s short- and
medium-term goals, with payment
levels based on five Key Performance
Areas (KPAs)
Through the KPAs, employees are
aligned with the key short- and
long-term strategic priorities of
Growthpoint and the interest of
shareholders. This in turn helps
to generate long-term returns to
shareholders |
|
The STI is determined by the committee on a
discretionary basis, with the maximum STI for executives
being 200% of the Total Fixed Remuneration (TFR) at the
time of making the STI award, which reflects the TFR in
September in any given year.
Actual company performance is measured against a
scorecard of KPAs, as set out in Part 2 of this report.
Performance achievement against the KPAs and Key
Performance Indicators (KPIs) is benchmarked against a
peer group of companies in the property sector, namely
Redefine, Emira, Hyprop, and SA Corporate. The peer
group changed as four companies have been taken over
and delisted. In exceptional cases, the committee has the
discretion to make ex gratia payments, where considerable
value has been added to shareholders. The targets
set out in the KPA scorecard translate to a maximum STI
achievable, and the committee then applies its discretion
to determine an appropriate STI for each executive
director, and member of the Executive committee.
A portion of the STI is paid in cash, and a portion of the
STI is deferred into zero cost options which vest in equal
tranches, over three years to provide a deferred element,
and assist with retention.
For executive directors and executive management,
50% of the STI is paid upfront in cash, and the remaining
50% is delivered on a deferred basis in zero cost options,
vesting over a three-year period of one third each,
following the award date. |
Long-term incentives (LTI)
| • |
Growthpoint Staff Incentive Scheme (GSIS), comprising:
For the executive directors, and executive management (“Executives”): |
| |
| – |
the Executive Retention Scheme |
|
| |
For other staff: |
| |
|
|
|
The LTIs drive and reward long-term,
sustained performance
measured against metrics which are
strongly aligned with the interests of
shareholders |
|
The Growthpoint Staff Incentive Scheme
One of Growthpoint’s core values is that “we own and
manage” our property portfolio. Through the GSIS we
achieve the ownership component of this value, in that all
of Growthpoint’s staff members (excluding executives)
are awarded zero cost options which vest over a five-year
period.
The vesting profile allows for 0% of the awards to vest
after year one, and 25% to vest in each successive year
after year two with the last vesting of each award taking
place after year five.
The GSIS currently provides for regular annual awards of
zero cost options to Growthpoint staff and the award of
reducing strike options as part of the Executive Retention
Scheme. The components, as applicable to executives, are
set out in more detail below.
The GSIS, in the form of zero cost options, is also used as
a mechanism for the deferred component of the STI for
executives.
The limit for the GSIS is 50 million shares, representing
around 1.8% of the issued capital of the company.
In the case of termination of employment, the GSIS
provides for forfeiture of all unvested options, except
for certain instances where, at the discretion of the
committee, pro-rata future vesting may be allowed (for
instance in the case of ‘good leavers’) or death in service.
Zero cost options (All staff excluding the executives)
Zero cost options are awarded annually where the
quantum of options awarded to each eligible employee
is based on a target multiple of their respective annual
GCTC. Target multiples are linked to market benchmarks
and can be increased by approval of the committee for
critical skills and individual retention.
The Executive Retention Scheme (ERS – part of the GSIS)
The ERS is a notional share purchase scheme and
is designed to retain executive directors and senior
management over the longer term. The option simulates
a share purchase scheme that is half funded with debt.
The ERS is not awarded on a regular basis, with a
significant initial award having been made in 2014.
Further awards will be made only if considered necessary
by the committee, as merited by specific retention risks.
The options granted on 1 April 2014 had an initial
strike price of R11.43 based on a 50% discount to the
Growthpoint 30 day clean VWAP price as traded on
the JSE.
Each option’s strike price will be adjusted on a notional
basis by:
| • |
increasing the strike price by 8.25% per annum
compounding on the distribution payment date
representing interest of the notional debt, and |
| • |
decreasing the strike price by the actual distribution
per share, declared and paid by the company. |
These options will vest on 1 April each year over the next
eight years as follows, and give the option holder the right
to acquire one Growthpoint share at the variable strike
price at the vesting date:
| 2015 |
0% |
| 2016 – 2017 |
10% pa |
| 2018 – 2020 |
20% pa |
| 2021 – 2022 |
10% pa |
|
General staff remuneration philosophy and strategy
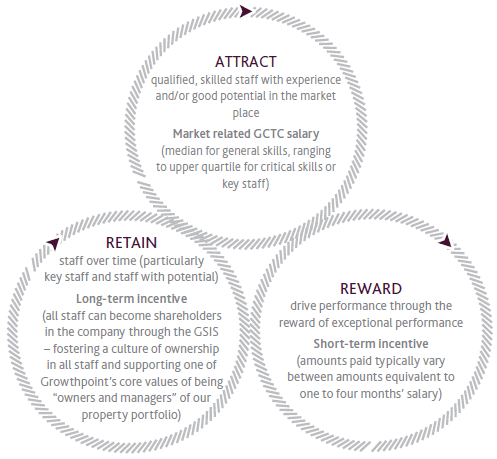
Growthpoint values all staff, and strives to
ensure that remuneration below executive
level is structured fairly, and all staff members
are rewarded for exceptional performance. We
recognise that remuneration forms an integral
part of the employment offering that enables
us to attract, reward and retain the staff we
require to manage the company effectively
and efficiently. We are particularly proud of
our GSIS, and believe that the participation of
all employees in the GSIS helps us to create
a culture of ownership, which contributes
towards employees that are satisfied and
engaged, and motivated to perform to the best
of their ability.
AVERAGE ON-TARGET PACKAGE FOR EXECUTIVE DIRECTORS |
|
 |
 |
|
PACKAGE DESIGN FOR EXECUTIVES
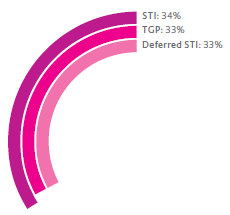
Packages are designed to provide the
appropriate balance between fixed
remuneration and variable “at risk”
remuneration. Fixed remuneration is
benchmarked against the same comparator
groups used to benchmark remuneration for
non-executive directors as set out in the table
below. Variable pay will, depending on the role,
function and responsibility of the executive
director, or Executive Committee member,
constitute between 40% and 75% of the total
remuneration of that executive director or
Executive Committee member. The average
on-target package for the executive directors
is depicted below (no LTI awards were made
during the year under review).
SERVICE CONTRACTS
The CEO and Managing Director have service
contracts with Growthpoint with reciprocal
six-month notice of termination provisions. The
Financial Director is on a standard employment
contract with a six-month reciprocal notice of
termination provision.
The service contracts provide for the following:
| • |
An indefinite period of service, subject to the normal retirement age of the company, with a six-month reciprocal notice of termination provision |
| • |
The termination provisions provide for paid
“garden leave” for the executives at the
company’s election |
| • |
In addition to “garden leave” there are also
restraints, in relation to the company’s
clients, staff and corporate opportunities |
| • |
KPAs and KPIs have been identified in
the contracts, which the executives are
measured against. |
REMUNERATION OF NON-EXECUTIVE
DIRECTORS
The following principles apply to the
remuneration of non-executive directors:
| • |
Fees are structured as an annual retainer
component and an attendance fee for
scheduled meetings |
| • |
Fees are reviewed annually and proposed at annual general meetings for approval |
| • |
The comparator group changed from the previous year and now includes the following companies: |
| Tiger Brands Limited |
|
Redefine Properties Limited |
| MMI Holdings Limited |
|
Sanlam Group Limited |
| Netcare Limited |
|
The Bidvest Group Limited |
| Mr Price Group Limited |
|
Aspen Pharmacare Holdings Limited |
| Discovery Limited |
|
Vodacom Group Limited |
| Woolworths Holdings Limited |
|
|
| • |
The group was selected on the basis of JSE
companies of similar size. It is the same as
that used for the executive directors |
| • |
The remuneration of non-executive directors
is targeted between the median and the
upper quartile of the comparator group.
Attendance at meetings of any ad-hoc sub-committee,
established for special purposes,
shall be remunerated on the basis applicable
to the established sub-committees. It is
expected that non-executive directors will
attend at least two ad-hoc meetings a year
without being paid. Payment for the ad-hoc
board and committee meetings will be
determined on a case by case basis by the
committee |
| • |
Non-executive directors are compensated
for travel and subsistence on official business
where necessary and to attend meetings |
| • |
Non-executive directors do not participate
in the company’s annual bonus plan or in any
of its long-term incentive plans |
| • |
None of the non-executive directors has a
contract of employment with the company.
Their appointments are made in terms of the
company’s Memorandum of Incorporation
and are confirmed at the first annual general
meeting of shareholders following their
appointment, and thereafter at three-yearly
intervals when they retire by rotation in
terms of the Memorandum of Incorporation. |
EXTERNAL APPOINTMENTS
Executive directors are not permitted to hold
external directorships or offices outside of
the Group, without the approval of the Board.
If such approval is granted, the executive
directors will not be permitted to retain such
earnings in their individual capacities. Please
see the AFS’s for detailed remuneration paid to
executive directors and the Chairman in respect
of services rendered to other Group companies.
NON-BINDING ADVISORY VOTE
Shareholders are requested to cast a non-binding
advisory vote on the aforementioned
Part 1 of this report.
PART 2: DISCLOSURE OF THE IMPLEMENTATION OF THE POLICIES FOR THE FINANCIAL YEAR
GUARANTEED PAY ADJUSTMENTS
An executive benchmarking of remuneration for executives and non-executive directors was
conducted in May 2015 to ensure that total reward packages were in line with market benchmarks.
In determining the GCTC increases for executive directors, the committee considered relevant
comparator group market data, using a new comparator group listed below. The average rate
of GCTC increase for executive directors was 9.2% taking into account the outcome of the
benchmarking exercise, as well as the changed role of the Managing Director, whilst the average
rate of increase of GCTC for the Executive Committee members including the Executive Directors
was 7.3%. On average, these increases were similar to those made to staff below executive level
which averaged out at 7.5%. The increases were effective on 1 July 2015 and are applicable for the
period July 2015 to June 2016.
This compares to the following average increases for the previous financial year:
| • |
For executive directors and executive committee members: 10.6% |
| • |
For managers and general staff: 7.7% |
| Previous comparator group |
|
New comparator group |
| Aspen Pharmacare Holdings Limited |
|
Aspen Pharmacare Holdings Limited |
| Discovery Limited |
|
Discovery Limited |
| Imperial Holdings Limited |
|
MMI Holdings Limited |
| Life Healthcare Group Holdings Limited |
|
Mr Price Group Limited |
| Mediclinic International |
|
Netcare Limited |
| Remgro Limited |
|
Redefine Properties Limited |
| RMB Holdings Limited |
|
Sanlam Group Limited |
| Shoprite Holdings Limited |
|
The Bidvest Group Limited |
| Tiger Brands Limited |
|
Tiger Brands Limited |
| Woolworths Holdings Limited |
|
Vodacom Group Limited |
| |
|
Woolworths Holdings Limited |
2015 STI OUTCOMES (CASH AND DEFERRED STI INTO ZERO COST
OPTIONS)
FY15 was one of the busiest years in Growthpoint’s history which saw it complete the effective
takeover of Acucap/Sycom, its largest property transaction to date and one of the largest, if not
the largest corporate takeover in the history of the property industry in South Africa, with property
assets valued at more than R18 billion being acquired and over 160 employees needing to be
transferred and integrated into the business.
The year was further characterised by the successful integration of the Abseq and Tiber businesses
and employees. Combined, the above transactions have seen Growthpoint’s total staff complement
grow to approximately 700, an increase of over 50% in just over two years, whilst the consolidated
gross asset value has grown to just over R100 billion.
Given a particularly weak overall economic backdrop, with GDP growth in South Africa below
2.0%, heavily impacted by the energy crisis and labour unrest resulting in an increase in overall
unemployment, the South African property portfolio (excluding V&A) performed admirably with
“like for like” net property income growing at 6.2% and overall vacancies remaining relatively
stable.
Costs were also well controlled with the property
cost-to-income ratio reducing to 24.0%
(FY14: 24.8%) and the operating expense
ratio at 3.8% (FY14: 3.8%). Notwithstanding
the subdued economic climate and outlook,
acquisition, disposal and development activity
(in addition to the Acucap/Sycom transaction)
remained robust with five properties being
acquired for R504 million in total and
18 properties being sold for R621 million at
an aggregate profit above historical cost plus
capex of R205 million.
The V&A continued to perform strongly with
total distributable income growing at 10.8% (also on a “like for like” basis). Annual growth
in turnover at the V&A has slowed to 11%,
however off a much higher base which has been
set over the past two years. Overall vacancies
at the V&A remain very low at 2.6% whilst the
cost-to-income ratio at 27.8% remains under
control. Momentum at the V&A in respect of
development continues to improve with the
capital value of developments in progress and
in the process of being approved exceeding
R3 billion.
GOZ as a stand-alone investment had one of
its best years ever achieving a total shareholder
return for the 12 months to 30 June 2015 of 36% which placed it second overall in terms
of the performance of Australian REITs. On a
consolidated basis, however, the performance
of GOZ was more modest, with 3.7% growth
in distributions per share which was in line
with budget and growth in net asset value per
share of 14.8%. GOZ had another active year
in terms of investment with the acquisition
of properties for an aggregate value of
AUD119.5 million.
The target performance set out in the table
below indicates the maximum possible STI payout
and Committee discretion is then applied to
determine the final STI amounts paid.
Performance outcomes
Actual performance in respect of the five key performance indicators (KPIs), compared to the target performance, is set out and illustrated in the table
below. Growthpoint aims to set targets which include stretch within the targets, and accordingly does not have a concept of “stretch” performance, as
strong performance is required to meet the targets set:
| |
|
KPI |
|
Weighing |
|
Actual |
|
Target |
|
Perfomance
achievement |
| (a) |
|
Growth in dividend per share: |
|
60% |
|
|
|
|
|
|
| |
|
Internal benchmark (budget) |
|
30% |
|
7.5% |
|
6.8% |
|
30% |
| |
|
Peer group benchmark |
|
30% |
|
7.5% |
|
9.4% |
|
24% |
| (b) |
|
Business growth: |
|
10% |
|
|
|
|
|
10% |
| |
|
– Gross asset base (R100,397 million vs R76,175 million) |
|
|
|
31.8% |
|
>5% |
|
|
| |
|
– Gross revenue growth (R7,740 million vs R6,442 million) |
|
|
|
20.5% |
|
>7% |
|
|
| |
|
– Dividend growth in absolute terms (R4,232 million vs R3,497 million) |
|
|
|
21.0% |
|
>5% |
|
|
| (c) |
|
Operational metrics: |
|
15% |
|
|
|
|
|
15% |
| |
|
– Property cost to Income ratio |
|
|
|
24% |
|
<27% |
|
|
| |
|
– Operating expense ratio |
|
|
|
3.8% |
|
<5% |
|
|
| |
|
– Overall vacancies |
|
|
|
5.7% |
|
<7% |
|
|
| |
|
– Total arrears (as % of collectables) |
|
|
|
7.4% |
|
<10% |
|
|
| (d) |
|
Qualitative factors: |
|
5% |
|
|
|
|
|
5% |
| |
|
– Compliance |
|
|
|
√ |
|
|
|
|
| |
|
– Development of people/culture/values |
|
|
|
√ |
|
|
|
|
| |
|
– Overall management review |
|
|
|
√ |
|
|
|
|
| |
|
– Industry participation |
|
|
|
√ |
|
|
|
|
| (e) |
|
Financial management: |
|
10% |
|
|
|
|
|
10% |
| |
|
– Loan to value ratio |
|
|
|
33.2% |
|
<45% |
|
|
| |
|
– Debt expiry profile |
|
|
|
2.9 years |
|
>3 years |
|
|
| |
|
– Interest rate hedging |
|
|
|
76.0% |
|
>75% |
|
|
| |
|
– Secured vs unsecured debt (longer-term 50/50) |
|
|
|
70/30 |
|
70/30 |
|
|
| |
|
– Moody’s rating |
|
|
|
Yes |
|
Investment grade |
|
|
| |
|
|
|
|
|
|
|
Total |
|
94% |
Notwithstanding the achievement, or otherwise, of these KPIs, ultimate discretion in respect of the payment of cash STI, or award of deferred STI,
remains with the committee and the Board of Directors.
Actual STI payments for executive directors
The executive directors received the following STI awards in respect of performance in FY15:
| Name |
|
Title |
|
STI – cash
R |
|
Deferred STI
R |
|
STI as % of GCTC*
% |
| LN Sasse |
|
CEO |
|
5 527 200 |
|
5 527 200 |
|
188 |
| EK de Klerk |
|
Managing Director |
|
3 995 000 |
|
3 995 000 |
|
188 |
| G Völkel |
|
Financial Director |
|
1 269 000 |
|
1 269 000 |
|
94 |
* Expressed as a percentage of the GCTC for FY16, being the GCTC applicable at the time the STI awards were approved by the Board.
EXECUTIVE RETENTION SCHEME (ERS) AWARDS GRANTED IN FY15
In line with our communication within our previous remuneration report, no awards were made under the ERS during the year under review.
DISCLOSURE OF THE VESTING OUTCOMES IN RESPECT OF GSIS AWARDS VESTING IN FY15
The value attributable to long-term incentives that vested in FY15 in terms of the GSIS (excluding deferred STIs) is disclosed in the table below.
TOTAL REMUNERATION OUTCOMES FOR FY15
The composition of remuneration outcomes in FY15 for the CEO, Managing Director and Financial Director is represented in the table below:
EXECUTIVE DIRECTORS’ REMUNERATION
Previously, the deferred STI vesting in the year under review was disclosed. In line with best practice we have changed our disclosure to reflect the
deferred STI earned in the year under review, which will be paid in 2016, 2017 and 2018. For ease of comparison, the total remuneration for FY14 is
depicted in a similar fashion.
| Name |
GCTC |
|
Cash bonus(1)
R |
|
Deferred STI(2)
R |
|
GSIS
vesting 2015(3)
R |
|
Total
remuneration
FY15
R |
|
Total
remuneration
FY14
R |
| LN Sasse |
5 550 000 |
|
5 527 200 |
|
5 527 200 |
|
10 801 032 |
|
27 405 432 |
|
27 651 312 |
| EK de Klerk |
3 850 000 |
|
3 995 000 |
|
3 995 000 |
|
5 406 060 |
|
17 246 060 |
|
16 796 882 |
| G Völkel |
2 350 000 |
|
1 269 000 |
|
1 269 000 |
|
– |
|
4 888 000 |
|
3 200 000 |
| Notes: |
| (1) |
Based on the FY15 performance and paid in cash in FY16. |
| (2) |
Deferred STI earned in 2015 year, payable in 2016, 2017 and 2018. |
| (3) |
GSIS awarded in prior years and vesting in the 2015 financial year, excluding deferred STI. |
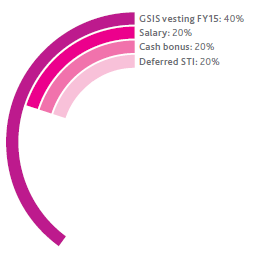
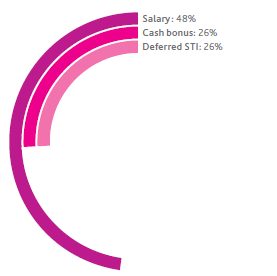
The actual remuneration outcomes paid to executive directors are graphically illustrated as follows:
| LN SASSE |
|
EK DE KLERK |
|
G VÖLKEL |
 |
|
 |
|
 |
NON-EXECUTIVE DIRECTORS’ FEES
Proposed non-executive directors’ fees for FY16
The following fees are proposed for FY16. The increase in the proposed non-executive directors’ fees for FY16 is based on the outcome of the
benchmarking exercise concluded in May 2015.
Schedule of retainer fees and fees payable per meeting:
| |
FY15 |
|
Increase
% |
|
FY16 |
|
| Basic fee (pa) |
|
|
|
|
|
|
| Chairman |
1 033 000 |
|
6.96 |
|
1 105 000 |
|
| Deputy Chairman |
123 000 |
|
6.91 |
|
131 500 |
|
| Director |
49 500 |
|
7.07 |
|
53 000 |
|
| Attendance fees — per meeting (x5) |
|
|
|
|
|
|
| Chairman |
173 400 |
|
6.97 |
|
185 500 |
|
| Deputy Chairman |
83 500 |
|
6.83 |
|
89 200 |
|
| Director |
55 700 |
|
7.00 |
|
59 600 |
|
| Audit Committee (x5) |
|
|
|
|
|
|
| Chairman |
52 000 |
|
6.92 |
|
55 600 |
|
| Members |
37 000 |
|
6.76 |
|
39 500 |
|
| Risk Committee |
|
|
|
|
|
|
| Chairman |
46 000 |
|
6.96 |
|
49 200 |
|
| Members |
31 000 |
|
7.09 |
|
33 200 |
|
| Property Committee* |
|
|
|
|
|
|
| Chairman |
46 000 |
|
20.9 |
|
55 600 |
|
| Members |
31 000 |
|
27.4 |
|
39 500 |
|
| Social, Ethics and Transformation Committee |
|
|
|
|
|
|
| Chairman |
40 250 |
|
6.83 |
|
43 000 |
|
| Members |
25 750 |
|
6.80 |
|
27 500 |
|
| Remuneration Committee |
|
|
|
|
|
|
| Chairman |
46 000 |
|
6.96 |
|
49 200 |
|
| Members |
31 000 |
|
7.09 |
|
33 200 |
|
| Nomination Committee |
|
|
|
|
|
|
| Chairman |
40 250 |
|
6.83 |
|
43 000 |
|
| Members |
25 750 |
|
6.80 |
|
27 500 |
|
| * |
The committee decided that, in order to recognise the importance of work done by the Property Committee, it should be proposed that the fees paid to this committee be increased
to the same level as that of the Audit Committee. Refer to special resolution in the notice of annual general meeting for approval of the fees by shareholders in terms of section
66 of the Companies Act. |
ACTUAL FEES PAID TO NON-EXECUTIVE DIRECTORS FOR FY15
The fees paid to non-executive directors for FY15 were paid on the basis presented in the tables in the AFS, as approved by the committee and by the
Board, on authority granted by shareholders at the annual general meeting held on 18 November 2014:
| |
Directors’ fees
FY15
R |
|
Directors’ fees
FY14
R |
|
| MG Diliza (Social, Ethics and Transformation Committee Chairman, Property Committee and Nomination Committee) |
527 350 |
|
511 500 |
|
| PH Fechter (Property Committee Chairman, Audit Committee and Nomination Committee) |
667 050 |
|
733 500 |
|
| LA Finlay (Audit Committee Chairman, Social, Ethics and Transformation Committee and Nomination Committee) |
635 300 |
|
602 500 |
|
| JC Hayward (Risk Management Committee Chairman, Audit Committee and Nomination Committee) |
667 050 |
|
622 500 |
|
| HS Herman (Remuneration Committee Chairman, Property Committee and Nomination Committee) |
606 050 |
|
681 000 |
|
| JF Marais (Board Chairman, Remuneration Committee and Nomination Committee Chairman) |
1 890 850 |
|
1 978 000 |
|
| HSP Mashaba (Board Deputy Chairman and Remuneration Committee) |
581 000 |
|
607 000 |
|
| SP Mngconkola (Social, Ethics and Transformation Committee and Risk Management Committee) |
442 550 |
|
337 000 |
|
| R Moonsamy (Social, Ethics and Transformation Committee and Property Committee) |
499 300 |
|
574 000 |
|
| NBP Nkabinde (Social, Ethics and Transformation Committee and Risk Management Committee) |
499 300 |
|
531 500 |
|
| CG Steyn (Audit Committee and Property Committee) |
309 150 |
|
692 500 |
|
| JHN Strydom |
– |
|
325 300 |
|
| FJ Visser (Remuneration Committee and Risk Management Committee) |
520 300 |
|
573 000 |
|
| Total |
7 845 250 |
|
8 769 300 |
|
SHAREHOLDER ENGAGEMENT
We strive to maintain transparent and active communication channels with our shareholders. During FY15, no queries were raised by shareholders.
APPROVAL
This remuneration report was recommended by the Remuneration Committee on 18 August 2015 for approval by the Board of Directors of
Growthpoint Properties Limited on 25 August 2015.
Signed on behalf of the Board of Directors
HS Herman
Remuneration Committee Chairman
25 August 2015

