Treasury Management
Growthpoint’s history of accelerated growth and its need for capital
has placed debt management at the forefront of the business. We
detail below the activities undertaken in this regard in respect of the
South African operations for FY15.
CAPITAL FLOWS
During FY15 new capital employed amounted to R20,6 billion, of which R11,7 billion was raised
from equity (share swap with Acucap shares, DRIPs and other) and R8,9 billion additional debt was
taken on. The capital together with proceeds realised from disposals was utilised for acquisitions,
property developments and capital expenditure, as well as to fund the additional investment in
GOZ and Growthpoint’s share of the development expenditure of the V&A Waterfront.
INTEREST BEARING LIABILITIES
| |
FY15
R’m |
|
% of
total debt |
|
FY14
R’m |
|
% of
total debt |
|
| South Africa1 |
|
|
|
|
|
|
|
|
| Secured debt: |
17 905 |
|
70.4 |
|
10 394 |
|
63.0 |
|
| Bank debt |
15 852 |
|
62.3 |
|
8 944 |
|
54.2 |
|
| Institutional financiers |
2 053 |
|
8.1 |
|
1 450 |
|
8.8 |
|
| Unsecured debt: |
7 539 |
|
29.6 |
|
6 105 |
|
37.0 |
|
| Bank debt |
4 480 |
|
17.6 |
|
1 796 |
|
10.9 |
|
| Corporate bonds |
2 659 |
|
10.4 |
|
3 909 |
|
23.7 |
|
| Commercial paper |
400 |
|
1.6 |
|
400 |
|
2.4 |
|
| Total South African debt |
25 444 |
|
100.0 |
|
16 499 |
|
100.0 |
|
| Australia2 |
|
|
|
|
|
|
|
|
| Secured debt: |
|
|
|
|
|
|
|
|
| Bank debt and loan note |
8 367 |
|
100.0 |
|
8 677 |
|
100.0 |
|
| Consolidated debt |
33 811 |
|
|
|
25 176 |
|
|
|
| 1 |
Includes debt from equity-accounted Tiber entities. |
| 2 |
Includes a cumulative foreign exchange difference of R1,9 billion (FY14: R2,3 billion). |
The significant increase in Growthpoint’s nominal liabilities was mainly due to the acquisition of
Acucap, which resulted in the consolidation of the debt of Acucap and Sycom. This consolidation
impacted the debt profile as the characteristics of Acucap’s and Sycom’s debt were different from
that of Growthpoint.
The challenges in the macro-economic environment together with the woes of African Bank
negatively impacted the liquidity in the debt capital markets for the year under review. Institutional
investors became inwardly focused and had less appetite for corporate bond issues. We found the
funding from the banks competitively priced compared to funding from the debt capital markets.
This was the reason we chose to repay two bond issues in the capital market (R1,25 billion in
total, maturities in December 2014 and January 2015), which were refinanced with bank funding.
We successfully continued to roll the R400 million commercial paper programme, although the
margins increased from 20 basis points in June 2014 to 36 basis points in June 2015. There are some
indications that the appetite for corporate issues in the bond market is returning. There has been a
lack of supply of listed corporate paper in the debt capital market, which should support demand
for high-quality issuers, like Growthpoint.
Growthpoint introduced an institutional
investor as a new funder, with unsecured
funding of R1 billion for a term of up to
seven years. This, together with other new
unsecured facilities, resulted in an increase of
total unsecured debt to R7,5 billion. However,
Acucap’s and Sycom’s debt consisted largely
of secured funding, which resulted in the ratio
of secured loans to property value increasing
to 22.8%. Total unencumbered assets,
including the equity-accounted investments,
as well as listed investments (but excluding the
investment in GOZ) amounted to R35,1 billion.
We will continue to focus on negotiating the
best possible terms for our debt.
COST OF FUNDING
The average cost of funding materially reduced
to 8.9% in June 2015 from 9.4% in June 2014.
This was mainly as a result of the lower cost
of funding of Acucap and Sycom (due to the
average shorter maturity of the debt and the
secured nature of the debt) and a reduction in
the percentage of fixed interest rate exposure
to total debt. Base interest rates however
increased during the year under review and are
expected to increase further in anticipation of
inflation pressures and interest rate hikes in the
United States.
Growthpoint has experienced pressure on
the credit spreads in newly negotiated loans.
The outlook on the local macro-economic
environment is not positive. It is therefore
our view that South African credit spreads
will continue their widening trend in the near
future. However, the demand for corporate
credit paper might counteract the increase in
margins somewhat.
MATURITY PROFILE
The weighted average term of the liabilities
has reduced from 3.5 years at 30 June 2014
to 2.9 years at 30 June 2015. Although
Growthpoint successfully managed to
negotiate longer-term debt, the average term of
the liabilities reduced mainly as a result of the
weighted average term of the debt of Acucap
and Sycom (1.7 years at date of acquisition).
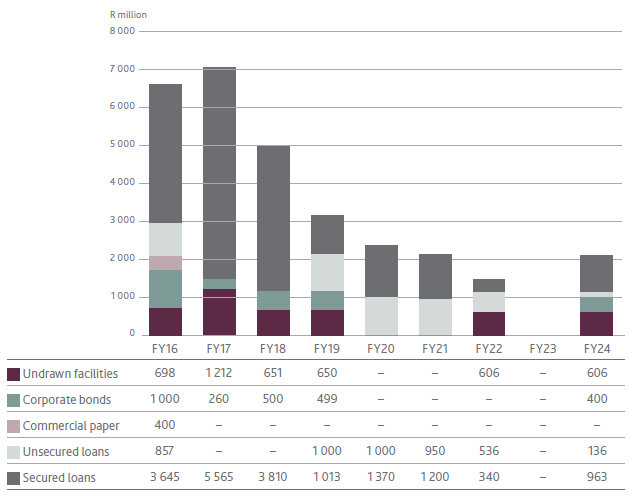
A significant amount of loans mature in FY16
and Growthpoint has commenced with a
re-financing strategy in this regard, with a
number of banks having already agreed to
extend the maturity date of loans amounting to
R1,4 billion, which are expiring in the next
twelve months.
In various discussions, financial institutions have
indicated their commitment to Growthpoint and Growthpoint is confident that it will be able to raise sufficient funding from the banking sector
and debt capital markets for its on-going investment programme as well as the re-financing of
maturing loans.
| DEBT MATURITY PROFILE AT FY15 (EXCLUDING GOZ) |
 |
CREDIT RATINGS AND COVENANTS
Growthpoint was extremely pleased with the upgrade of its Moody’s credit ratings in May 2015:
| Issuer – Global scale rating |
Baa2 |
|
| Short-term – Global scale rating |
P-2 |
|
| Issuer – National scale rating |
A1.za |
|
| Short-term – National scale rating |
P-1.za |
|
The outlook on all ratings is stable. The upgrade of our investment-grade ratings shows increased
confidence in Growthpoint’s core credit quality on a globally comparable basis for REITs and other
commercial property firms.
Growthpoint remains well within the covenant ratios that it is exposed to through its loans.
The most constraining contract limits are reflected in the table:
| Covenants |
Limit |
|
FY15 |
|
FY14 |
|
| Incl. GOZ |
|
Excl. GOZ |
|
Incl. GOZ |
|
Excl. GOZ |
|
| Loan-to-value [Nominal debt (net of cash)/ Property fair value] |
≤55% |
|
33.2% |
|
32.1% |
|
30.8% |
|
27.4% |
|
| Interest cover [Net property income/ Net interest expense] |
≥2.0 |
|
3.4x |
|
3.4x |
|
3.3x |
|
3.5x |
|
Although Acucap was acquired on a share swap basis, Acucap’s loan to value (41.9% for FY15) was higher than that of Growthpoint, which resulted in
an increase in Growthpoint’s loan-to-value ratio. We are targeting to maintain a loan-to-value ratio below 40%.
INTEREST RATE RISK
MANAGEMENT
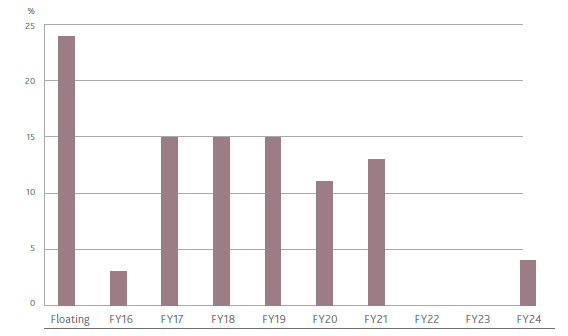
At the end of June 2015, 76.0% of the interest
exposure on the liabilities was fixed (including
forward starting swaps) compared to 78.4% in
June 2014. As Acucap had a different hedging
policy, its debt was only 48.1% hedged as at
date of acquisition. This resulted in a reduction
in Growthpoint’s overall hedged percentage.
The weighted average maturity of the fixed
interest rate profile reduced from 4.3 years to
3.5 years, mainly as a result of the shorter-term
nature of Acucap’s swaps.
Growthpoint believes it is well positioned
for anticipated interest rate increases
as a 1% increase in interest rates would
increase Growthpoint’s interest expense by
R61,1 million, which represents 2,3 cents of
dividend per share. In order to reduce the
volatility in its interest expense, Growthpoint
has a conservative policy of maintaining a fixed
interest rate profile on at least 75% of its total
outstanding debt.
EXCHANGE RATE RISK
MANAGEMENT
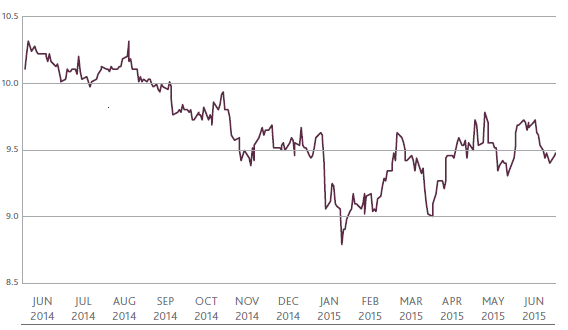
Due to the investment in GOZ, our results are
subject to changes in the AUD/ZAR exchange
rate. The bulk of the actual investment is not
hedged on the balance sheet, however the
future distributions from GOZ are partially
hedged through forward exchange rate
contracts for up to three distribution periods
to achieve less volatility in our income. It is
estimated that for FY16 distribution from
GOZ, a strengthening of R1 to the AUD would
decrease our earnings by R37,8 million as 46%
of the anticipated distribution is hedged. This
represents approximately 1.4 cents in dividend
per share.
Growthpoint’s earnings are minimally impacted
by volatility in the EUR/ZAR rate, which could
potentially impact the earnings from the
investment in the Stenham European Shopping
Centre Fund (SESCF).
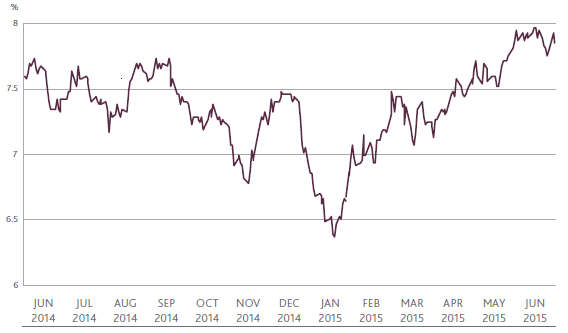
| FY15: FIVE-YEAR SWAP RATE |
 |
| FY 15: FIXED INTEREST RATE EXPIRY PROFILE RSA |
 |
| FY15: AUD/ZAR |
 |

