OFFICE
 Our premier office
portfolio comprises
184 properties valued
at R33,0 billion,
which includes
properties from
the Acucap and
Sycom portfolios
incorporated during
FY15
Our premier office
portfolio comprises
184 properties valued
at R33,0 billion,
which includes
properties from
the Acucap and
Sycom portfolios
incorporated during
FY15
MARKET ENVIRONMENT
Challenging market conditions in recent years
have resulted in both sustained vacancies and
slowing rental growth in the office sector. The
SAPOA Office Vacancy Survey reports overall
vacancies of 11.2% at Q1:2015. This is in line
with office vacancies during 2014, which ranged
between 11.2% and 11.6%. This confirms office
vacancies are not improving. Asking rentals
across the market achieved growth of 6.0%,
which is flat in real terms.
Vacancy levels are closely linked to property
grade. P- and A-grade properties reflected
vacancies of 6.3% and 9.2% respectively for
Q1:2015, according to the SAPOA survey. In
contrast, B- and C-grade properties reported
vacancies of 13.7% and 15.7%. This supports
Growthpoint’s strategy to invest in premium
office properties. This trend has also spurred a
flurry of office refurbishments in the market, to
improve asset quality.
Development remains robust at 4.5% of
the existing supply. The pre-let portion of
developments in the sector has been steadily
increasing and stands at 69% overall, reflecting
caution among financiers and developers.
Importantly, most activity is taking place in
Sandton.
The Sandton node still dominates the supply
of top-end space in the country, with 45% of
the P-grade market, and 10% of the A-grade
market. Although 80% of development in
Sandton is pre-let, tenants moving into these
new buildings will vacate their existing premises,
leaving gaps that exacerbate vacancies in older
properties.
The cost of occupancy for office tenants
continues to rise given the ever-increasing
cost of electricity and assessment rates. This
places pressure on rentals and results in highly
competitive leasing drives.
INTEGRATION OF ACUCAP AND
SYCOM PORTFOLIOS
The office component of the Acucap and Sycom
portfolios, acquired by Growthpoint during
2015, comprises 26 properties, introducing
a further
321 593m² of lettable space to our
portfolio, with a value of R6,8 billion at FY15.
They have had a positive impact on the vacancy
levels in the office portfolio as a whole, and
their management teams are being integrated
into our office division.
PERFORMANCE
Growthpoint’s office portfolio upheld
performance, increasing year-on-year net
property income on a like-for-like basis by 5.6%
to R1,2 billion. For the total portfolio, we
increased net property income by 33.5%
to R2,1 billion, of which R129,6 million was
contributed by the newly acquired Acucap and
Sycom properties.
Growthpoint’s office portfolio won the 2015
IPD Direct Property Investment Award for
the highest annualised direct property total
return on capital employed over three years to
31 December 2014, measured by leading
provider of research-based indexes and
analytics worldwide, MSCI. The Growthpoint
office portfolio delivered a 16.7% total return
over the three years, outperforming the IPD
office benchmark of 13.0%.
Gross rental per square metre has increased
since 2006 as follows:
| Year |
Gross
rental/m²
R |
|
Increase
% |
|
| 2006 – 2007 |
67 |
|
|
|
| 2007 – 2008 |
79 |
|
17.9 |
|
| 2008 – 2009 |
92 |
|
16.5 |
|
| 2009 – 2010 |
103 |
|
12.0 |
|
| 2010 – 2011 |
109 |
|
5.8 |
|
| 2011 – 2012 |
115 |
|
5.5 |
|
| 2012 – 2013 |
123 |
|
7.0 |
|
| 2013 – 2014 |
132 |
|
7.3 |
|
| 2014 – 2015 |
142 |
|
7.6 |
|
Through proactive cost control we reduced
our property expense-to-income ratio slightly
from 23.8% in FY14 to 23.1% in FY15 despite
significant increases in assessment rates and
utilities. We make every effort to reduce
property expenses on vacant offices, but it isn’t
always possible to keep expense ratios at the
levels achieved in times of full occupancy.
Our increased portfolio GLA totalled
1 790 428m² by the end of FY15 and, despite its
significant growth in size, our vacancy level was
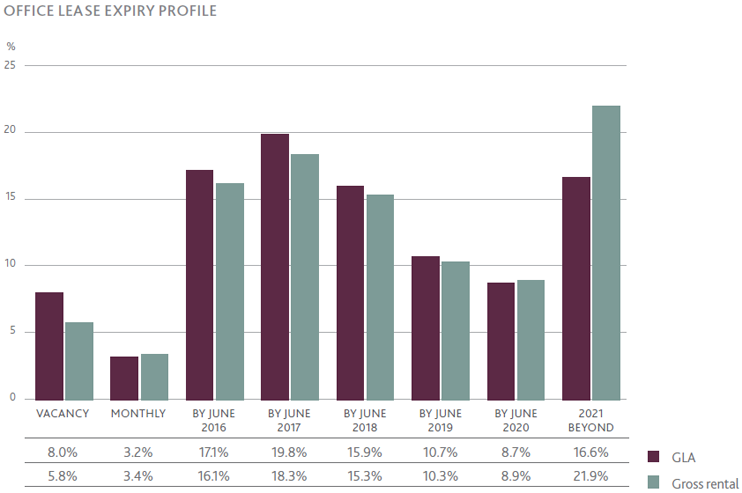
maintained at 8.0%. Our renewal success rate
was impacted by difficult market conditions.
At 62.0% it was 1% lower than the prior year.
Growth in renewal rental has dropped slightly
during the year, from 1.6% to 1.5%, with our
focus being firmly on retaining clients.
Arrears for the portfolio excluding the Acucap
acquisition were on par with the arrears
recorded at FY14, a low 3.5% of collectables.
The difficult economic climate is putting
clients’ ability to pay under pressure but we
are confident, with our proactive credit control
strategies, our arrears will be well controlled.
During the year we sold nine properties which
no longer met our investment criteria. Proceeds
from these disposals totalled R430,5 million,
achieving a capital profit of R136,5 million. This
was used to invest in new developments and
acquisitions. We have entered into agreements
to sell further property for R469,3 million.
We acquired property in Wierda Valley and
signed an acquisition agreement for a further
property in the same area. This furthers our
strategy to increase our holdings in the area
adjacent to the Discovery Development.
| ENVIRONMENTAL COMMITMENT
With our game-changing approach to doing business we are crafting an office portfolio that
is a growing example of sustainable development and operations. Our Sustainability Strategic
Framework incorporates five strands.
| 1. Utilities management |
| |
Better utility efficiency can only be achieved if consumption is accurately metered.
Growthpoint has partnered with Remote Monitoring Solutions to ensure precise billing
and metering. RMS has also developed an online tool that helps Growthpoint to forecast
and budget for utilities. |
| 2. Consumption efficiency |
| |
The uptake of the Growthpoint Green Addendum to leases has been successful and signed
by over 80% of our office clients. This addendum has allowed Growthpoint to record
savings on utility bills from our various green initiatives. These savings are then split
equally between Growthpoint and our clients. The utility savings we have achieved are
mainly the result of our light-fitting roll-out project. We’re examining several other green
initiatives.
GBCSA has developed the Energy and Water Performance rating tool, sponsored by
Growthpoint and Eskom, to benchmark existing buildings’ performance. Growthpoint has
assessed all of its office buildings using this tool. This analysis allows our sustainability
team to set up various sustainable strategies to ensure increased efficiency, and better
building performance. |
| 3. Renewable energy |
| |
To ensure future energy security, contribute to the mitigation of our clients’ carbon tax
risks, and meet their growing demand for sustainable space, we are exploring several
alternative clean energy sources. These include solar gas to energy and waste to energy. |
| 4. Sustainable development |
| |
Growthpoint is recognised for our growing portfolio of award-winning green-rated
buildings. So far, we have achieved Green Star SA ratings for over 20 of our office buildings,
with more in the pipeline. We target a minimum 4-Star Green Star SA rating for all new
office developments. |
| 5. Strategic projects |
| |
The strategic project focus area usually takes a more holistic approach over all sectors and
is discussed in more detail in the Key Matters section – Environmental Considerations. |
|
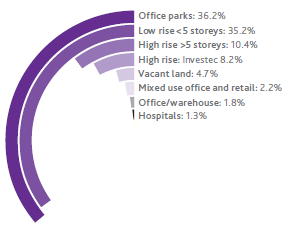
| OFFICE VALUE BY TYPE |
|
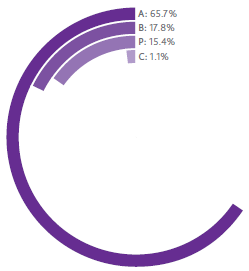
OFFICE GLA BY BUILDING GRADE |
 |
|
 |
| Reducing electricity consumption
in our office buildings |
We strive for long-term leases. Our weighted
average term to lease expiry is 4.2 years, with
an average in-force escalation of 7.7% |
 |
PROSPECTS
We expect continued challenging market
conditions for the office sector in the coming
year but are confident that, with our prime
portfolio located across sought-after nodes,
we are well positioned to take advantage of any
increase in demand for office space.
Our focus remains tenant retention and
reducing vacancies and we have a number of
innovative strategies to keep our vacancies
below the SAPOA benchmark. These include: |
| Average electricity consumption for a selected sample of
41 office buildings. |
Key performance areas
| |
FY15 |
|
FY14 |
|
Increase/
(decrease) |
|
| Gross property revenue (R’million) |
2 758 |
|
2 086 |
|
672 |
|
| Property expenses (R’million) |
(636) |
|
(496) |
|
140 |
|
| Net property income (R’million) |
2 122 |
|
1 590 |
|
532 |
|
| Property expense ratio (%) |
23.1 |
|
23.8 |
|
(0.7) |
|
| Vacancies (%) |
8.0 |
|
8.0 |
|
– |
|
| Arrears (R’million) |
18,8 |
|
10,5 |
|
8,3 |
|
| Bad debt provision (R’million) |
7,4 |
|
4,1 |
|
3,3 |
|
| Average gross rental (R per m2/month) |
142 |
|
132 |
|
10 |
|
| Forward yield (%) |
8.4 |
|
8.3 |
|
0.1 |
|
| Average in-force escalation (%) |
7.7 |
|
8.3 |
|
(0.9) |
|
| Weighted average lease period (years) |
4.2 |
|
4.2 |
|
– |
|
| Asset value (R’billion) |
33,0 |
|
24,3 |
|
8,7 |
|
| Number of properties |
184 |
|
165 |
|
19 |
|
| GLA (m2) |
1 790 428 |
|
1 460 741 |
|
329 687 |
|
| Value (excluding bulk) per m2 (R) |
17 562 |
|
16 257 |
|
1 305 |
|
| Capital expenditure (R’million) |
1 003 |
|
543 |
|
460 |
|
| Driven by demand
and opportunity,
we also acquire
premium sites and
develop innovative,
operationally efficient
and cost effective
sustainable buildings
for blue-chip
companies |
| • |
The Growthpoint Smartmove Campaign,
which offers incentives of up to a year’s
rental to tenants taking up space in
specific buildings which have long-standing
vacancies. This initiative has been hugely
successful in particular nodes |
| • |
Our newly initiated maintenance service
desk, which seeks to enhance the quality and
turnaround time of our maintenance teams |
| • |
Our focus on sustainable buildings, as
described earlier |
| • |
The Undeposit, which allows prospective
tenants to pay a one-off fee rather than
putting down a deposit for their premises.
This releases capital that can be better spent
in client’s businesses. |
Top 10 office tenants
Top
| |
Tenant |
GLA*
m2 |
|
% of
total office
GLA |
|
| 1 |
Investec Bank Limited |
85 134 |
|
5.2 |
|
| 2 |
Deloitte (South Africa) |
51 202 |
|
3.1 |
|
| 3 |
Transnet Limited |
31 535 |
|
1.9 |
|
| 4 |
ABSA Bank Limited |
27 516 |
|
1.7 |
|
| 5 |
Netcare Hospitals Proprietary Limited |
17 867 |
|
1.1 |
|
| 6 |
Business Connexion Proprietary Limited |
36 093 |
|
2.2 |
|
| 7 |
EOH Mthombo Proprietary Limited |
26 906 |
|
1.6 |
|
| 8 |
Mobile Telephone Networks Proprietary Limited |
20 281 |
|
1.2 |
|
| 9 |
Anglogold Ashanti Limited |
19 381 |
|
1.2 |
|
| 10 |
Hatch Goba Proprietary Limited |
20 167 |
|
1.2 |
|
| Total of Top 10 |
336 082 |
|
20.4 |
|
| * Ranked in terms of gross monthly rental. |
Top 10 office properties by value
| |
Property name |
|
Location |
Value
Rm |
|
% of total
office portfolio |
|
GLA*
m2 |
|
% of
total office
GLA |
|
| 1 |
The Woodlands Office Park |
|
Woodmead |
2 609 |
|
7.9 |
|
114 396 |
|
6.4 |
|
| 2 |
Investec |
|
Sandton |
2 338 |
|
7.1 |
|
70 945 |
|
4.0 |
|
| 3 |
Constantia Office Park |
|
Roodepoort |
1 023 |
|
3.1 |
|
72 420 |
|
4.0 |
|
| 4 |
The Place |
|
Sandton |
1 001 |
|
3.0 |
|
34 077 |
|
1.9 |
|
| 5 |
Inanda Greens |
|
Sandton |
890 |
|
2.7 |
|
40 760 |
|
2.3 |
|
| 6 |
Harrowdene Office Park |
|
Woodmead |
791 |
|
2.4 |
|
42 082 |
|
2.4 |
|
| 7 |
Growthpoint Business Park |
|
Midrand |
598 |
|
1.8 |
|
70 201 |
|
3.9 |
|
| 8 |
Tygerberg Park |
|
Cape Town |
580 |
|
1.8 |
|
28 726 |
|
1.6 |
|
| 9 |
MontClare Place |
|
Cape Town |
551 |
|
1.7 |
|
29 446 |
|
1.6 |
|
| 10 |
Turbine Hall and Square |
|
Johannesburg |
487 |
|
1.5 |
|
22 796 |
|
1.3 |
|
| Total of Top 10 |
|
|
10 868 |
|
33.0 |
|
525 849 |
|
29.4 |
|
| OFFICE PROPERTIES TOP 10 BY VALUE |
| 1 790 428m2 total GLA |
| R2,8 billion total revenue |
| Our properties are in prime office
nodes across South Africa’s major
metropolitan areas. Our clients are
mostly blue-chip businesses. Over
80% of our properties are P- or
A-grade, making a high-quality
portfolio |
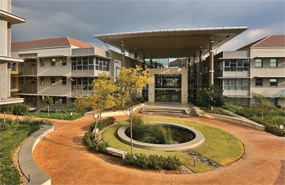
| THE WOODLANDS OFFICE PARK |
WOODMEAD |
This office park, valued at R2,6 billion, consists of a number of buildings
totalling 114 396m2 of commercial office space. The buildings are situated
in a low density, game park environment with free roaming blesbok,
impala, springbok, other smaller animals and bird life. The Woodlands
boasts amenities such as a restaurant, a gym, a nursery school, hairdresser
and dry cleaner. The park is on a Gautrain Shuttle route and is known in the
area for hosting the park run. |
 |
|
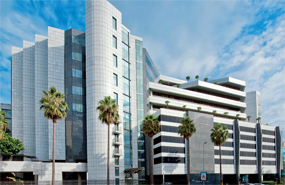
This iconic P-grade office building of 70 945m2 is a landmark at the gateway
to the central Sandton banking hub. It is valued at R2,3 billion and is fully
let to a single tenant, Investec, on a long-term lease. |
 |
| CONSTANTIA OFFICE PARK |
ROODEPOORT |
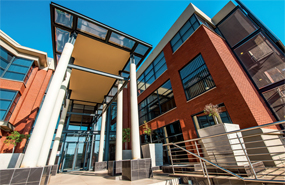
With a superb location benefiting from excellent N1 highway visibility and
accessibility, together with amenities including a Virgin Active Gym, Spur
family restaurant and a Protea Express Hotel, it offers a combination of
A- and B-grade office space to 90 tenants, set in a lush park environment.
The 72 420m2 office park is valued at R1,0 billion and is 88% let to major
tenants like MTN, Afrisam and Primedia. |
 |
|
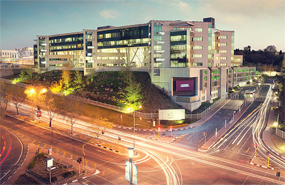
Situated at Sandton’s premier address, The Place comprises P-grade office
space across 34 077m2. It is valued at R1,0 billion and is 90% let to major
tenants, which include AON, Macquarie Africa and Growthpoint. |
 |
|
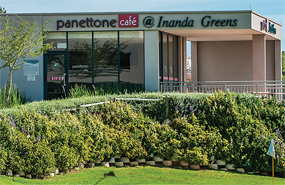
This A-grade office park has 10 buildings totalling 40 760m2 valued at
R890 million. It is 90% let and has 24 tenants including Fasken Martineau,
Advtech and FNB. |
 |
| HARROWDENE OFFICE PARK |
WOODMEAD |
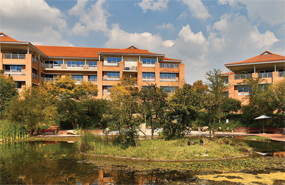
This office park has 42 082m2 of commercial offices situated in landscaped
gardens, and is valued at R791 million. This park is located close to the
M1/Woodmead drive off ramp and is next to and integrated with The
Woodlands Office Park. Harrowdene enjoys the shared amenities with The
Woodlands and is also on the Gautrain Shuttle route.
|
 |
| GROWTHPOINT BUSINESS PARK |
MIDRAND |
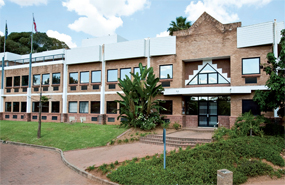
This mixed-use office park is well-located and enjoys N1 highway
visibility with easy access from the Allandale Road interchange. Valued at
R598 million, it offers 70 201m2 of A- and B-grade office space to
28 tenants, including Continuity SA, Nashua Communications, Fresenius
Kabi SA and Nike. It is 96% let. |
 |
|
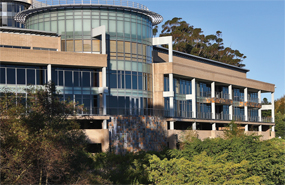
This 28 726m2 office park is valued at R580 million. It is located in
Plattekloof, Cape Town and has good views across the peninsula towards
Table Mountain. Its proximity to the N1 enables efficient accessibility to
all other major commercial nodes in Cape Town. This park is particularly
convenient in respect of the residential suburbs of Plattekloof, Durbanville,
Bellville, Parow, Edgemead and Panorama. |
 |
| MONTCLARE PLACE |
CAPE TOWN |
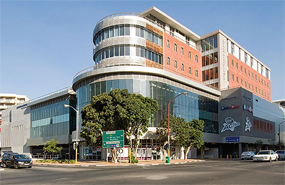
This mixed use development, integrating retail, a gym and A-grade offices,
totalling 29 446m2 is valued at R551 million and is fully let. It has 21 tenants
including Pick n Pay Retailers, Coronation Asset Management and Kagiso
Asset Management. |
 |
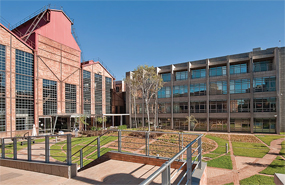
| TURBINE HALL AND SQUARE |
JOHANNESBURG |
Fully let to three tenants, including Anglogold Ashanti and The Forum, this
property comprises 22 796m2 of business space. Valued at R487 million,
the building is an iconic part of Johannesburg’s history and skyline. It was
originally a power station for the city in the 1920s. |
 |